Dataset EditorUsing React and Redux with JavaScript |
Summary
Create a dataset editor using a JavaScriptA language that can run in the browser to make websites interactive. framework with ReactJavaScript library for building interactive applications from reusable components. and ReduxA predictable application state container for JavaScript applications. to simplify the development of interactive components.
Overview
Implementation
-
Install JavaScriptA language that can run in the browser to make websites interactive. Environment
- Use HomebrewApplication used to install XDebug and NodeJS on Macbook. to install NodeJSA non-browser based environment in which JavaScript can be run. and NPMThe default package manager for the JavaScript runtime environment NodeJS.
brew install node
- Make a directory to hold JavaScriptA language that can run in the browser to make websites interactive. Code
cd /Applications/MAMPPersonal webserver stack to allow PHP and MySQL development on MacOS./htdocs
mkdir Javascript - Initialize an NPMThe default package manager for the JavaScript runtime environment NodeJS. Package
npm init
- Use NPMThe default package manager for the JavaScript runtime environment NodeJS. to install ReactJavaScript library for building interactive applications from reusable components. and ReduxA predictable application state container for JavaScript applications.
npm install --save react react-dom
npm install --save redux
npm install --save react-redux - Use NPMThe default package manager for the JavaScript runtime environment NodeJS. to install BabelA library that converts modern JavaScript syntax into a backward compatible version for use in older browsers.
npm install --save-dev babel-loader
npm install --save-dev babel-core
npm install --save-dev babel-preset-env
npm install --save-dev babel-preset-react
npm install --save-dev babel-plugin-transform-object-rest-spread
npm install --save-dev babel-plugin-transform-class-properties - Use NPMThe default package manager for the JavaScript runtime environment NodeJS. to install WebpackWebpack transforms and bundles JavaScript classes into modules for use in a browser.
npm install --save-dev webpack
npm install --save-dev webpack-dev-server@2.11.1
npm install --save-dev html-webpack-plugin
npm install --save-dev webpack-cli
- Use HomebrewApplication used to install XDebug and NodeJS on Macbook. to install NodeJSA non-browser based environment in which JavaScript can be run. and NPMThe default package manager for the JavaScript runtime environment NodeJS.
-
Configure JavaScriptA language that can run in the browser to make websites interactive. Environment
- Create Subdirectories
.../Javascript/src to hold source code files .../Javascript/build to hold files generated by WebpackWebpack transforms and bundles JavaScript classes into modules for use in a browser. - Create WebpackWebpack transforms and bundles JavaScript classes into modules for use in a browser. Configuration File
.../Javascript/webpack.config.jsVendor Libraries ['react', 'react-dom']
(specifies how the code should be split into bundle.js and vendor.js)Entry Point ./src/index.js Output Location /build Module Rules Applies babel-loader during the build process Plugins CommonsChunkPlugin
(responsible for splitting code into bundle.js and vendor.js modules)
htmlWebpackPlugin
(simplifies the creation of HTML files used to serve the WebpackWebpack transforms and bundles JavaScript classes into modules for use in a browser. bundle) - Create BabelA library that converts modern JavaScript syntax into a backward compatible version for use in older browsers. Configuration File
.../Javascript/babel.rcPresets babel-preset-env converts modern JavaScriptA language that can run in the browser to make websites interactive. syntax react converts ReactJavaScript library for building interactive applications from reusable components. syntax PlugIns transform-class-properties converts fat arrow method syntax transform-object-rest-spread converts object destructuring and spread operations - Add Scripts to NPMThe default package manager for the JavaScript runtime environment NodeJS. Package
.../Javascript/package.jsonbuild webserver server webserver-dev-server
- Create Subdirectories
-
Create JavaScriptA language that can run in the browser to make websites interactive. Classes
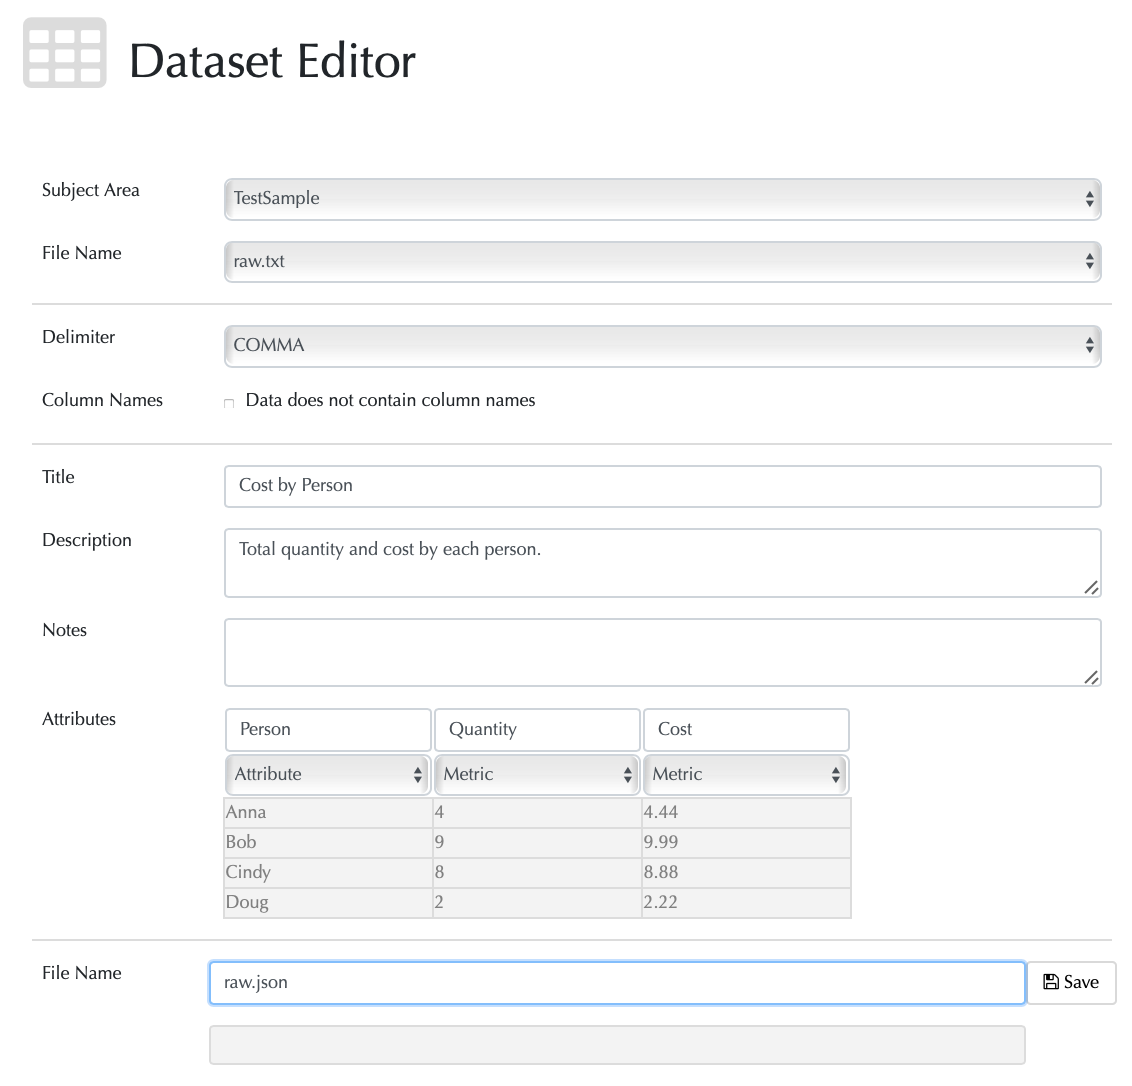
The application was broken into four areas - FileSelector, TextParser, Dataset, SaveFile, each with their own ReactJavaScript library for building interactive applications from reusable components. container class, and action and reducer files. In addition, there is an HTTPRequest script to handle calls to the web server.
FileSelector Contains the form controls for subject and file selection. Responsible for retrieving the list of available subjects and files from the web server as well as the contents of the selected file. TextParser If the file is not a JSON file, it shows the controls that determine how the text is parsed, otherwise, the container is not shown. Responsible for generating the dataset object either directly read from the JSON or by parsing the text. Dataset Contains the controls that allow the attributes of the Dataset to be edited. SaveFile Contains the input control to set the saved file name and a button to initiate the save. -
Modify PHPServer-side scripting language for web development. Classes and HTML Views
- Copy WebpackWebpack transforms and bundles JavaScript classes into modules for use in a browser. Files to Public Directory - /public/js/tbd. Use WebpackWebpack transforms and bundles JavaScript classes into modules for use in a browser. to build the bundle.js and vendor.js files and copy them to where they can be referenced by the HTML Dataset Editor page.
- Modify Controller Superclass - /Core/Controller.php to add the below methods to supply data to the Dataset Editor:
getTree Returns the subdirectories and files in the selected directory. getFile Returns the contents of the selected file. writeFile Saves the given contents to the specified file name. - Modify Dataset Controller Class - /App/Controllers/Dataset.php to add the editor method to display the new editor view.
-
Create Dataset Editor View - /App/Views/Dataset/editor.html to contain the div element with the classes recognized by the JavaScriptA language that can run in the browser to make websites interactive. code to trigger the insertion of the Dataset Editor application.
<div class="tbd-app tbd-DatasetEditor"></div>
-
Create Infrastructure Subject Area
- Create Controller - App/Controller/Infrastructure.php to manage the display of the index and individual (show) pages.
- Create View Files - App/Views/Content/index_large-icon.html and App/Views/Content/show.html. (This is a departure from other subject areas that have their own separate files. Going forward all new subject areas will use files in the Content folder to reduce redundancy. Old subject areas will be converted over in a future project.)
- Modify Home Page - App/Views/Home/index.html to include references to the new Infrastructure subject area.
-
Set up Google SignInJavaScript and PHP libraries to integrate Google sign-in into the website.
- Configure a Google Project - At the "Google Sign-In for Websites" page configure a project and OAuth Client and get the Client Id.
- Install Google PHPServer-side scripting language for web development. API Client - Use ComposerUsed to manage the installation of third-party PHP libraries. to install Google Sign-In:
composer require google/apiclient
- Modify User PHPServer-side scripting language for web development. Controller Class - /App/Controller/User.php to deactivate methods connected to old account creation process (e.g. show, create, forgot, update, delete, updatePassword, activate, resetPassword) and create new googleLogin method.
- Create User Login View - /App/View/User/index.html which references the Google JavaScriptA language that can run in the browser to make websites interactive. API and displays the regular login form as well as the Google sign-in button.
-
Add Slideshow to Home Page
- Modify Home Page View - /App/View/Home/index.html to add the elements that represent the slides with the associated images and text. Add formatting to /public/css/tbd-base.css. (See W3 School How To - Slideshow for details.)
- Modify Base JavaScriptA language that can run in the browser to make websites interactive. File - /public/js/tbd-base.js to animate slideshow.
-
Fix SVG Alignment Issue
- Modify Configuration Class - /Visualizations/src/Dataset/Config.js, to add hasFaultyAlignment setting to Configuration which is set to true if the userAgent indicates Edge or Firefox.
- Modify Chart Superclass - /Visualizations/src/Chart/Chart.js, to pass the new hasFaultyAlignment setting when initializing the classes LegendArea, HAxisArea and YAxisArea.
- Modify LegendArea, HAxisArea, and YAxisArea Classes - /Visualization/src/Area/*Area.js, so the init method captures hasFaultyAlignment setting and the setShapes method tweaks the x and y coordinates if hasFaultyAlignment is true.
Screenshot